
Insights & Metrics
Where to find Insights
Section titled “Where to find Insights”You can access Insights from two places in Cosine Cloud:
- Top Navigation Bar - Select Insights in the main navigation to open the team and project dashboards.

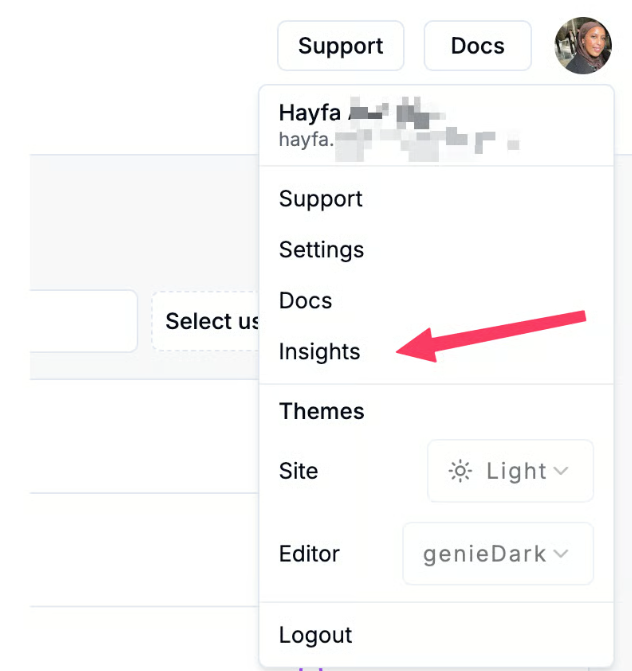
- User Menu - Open your profile menu in the top right corner and select Insights to access your personal dashboard.
Overview
Section titled “Overview”At the top of the dashboard, you’ll see Developer Hours Saved - an estimate of the amount time it would have taken a human developer to do the tasks Cosine has done for you. This reflects the measurable impact of Cosine on developer productivity.
The dashboard aggregates activity across your team and provides flexibility in how you view it:
- Snapshot of overall team activity across all projects.
- Project-specific insights for drilling down into individual metrics.
Filters & Exporting
Section titled “Filters & Exporting”Before diving into specific metrics, you can tailor the dashboard to your needs:
- Timeframe Selector - adjust the date range for all charts (default: All Time).
- User Filter - focus on a specific team member or subset of your team.
- Project Filter - focus on project-level insights.
- CSV Export - download raw data from any chart fro analysis.
We currently surface the following insights in the dashboard:
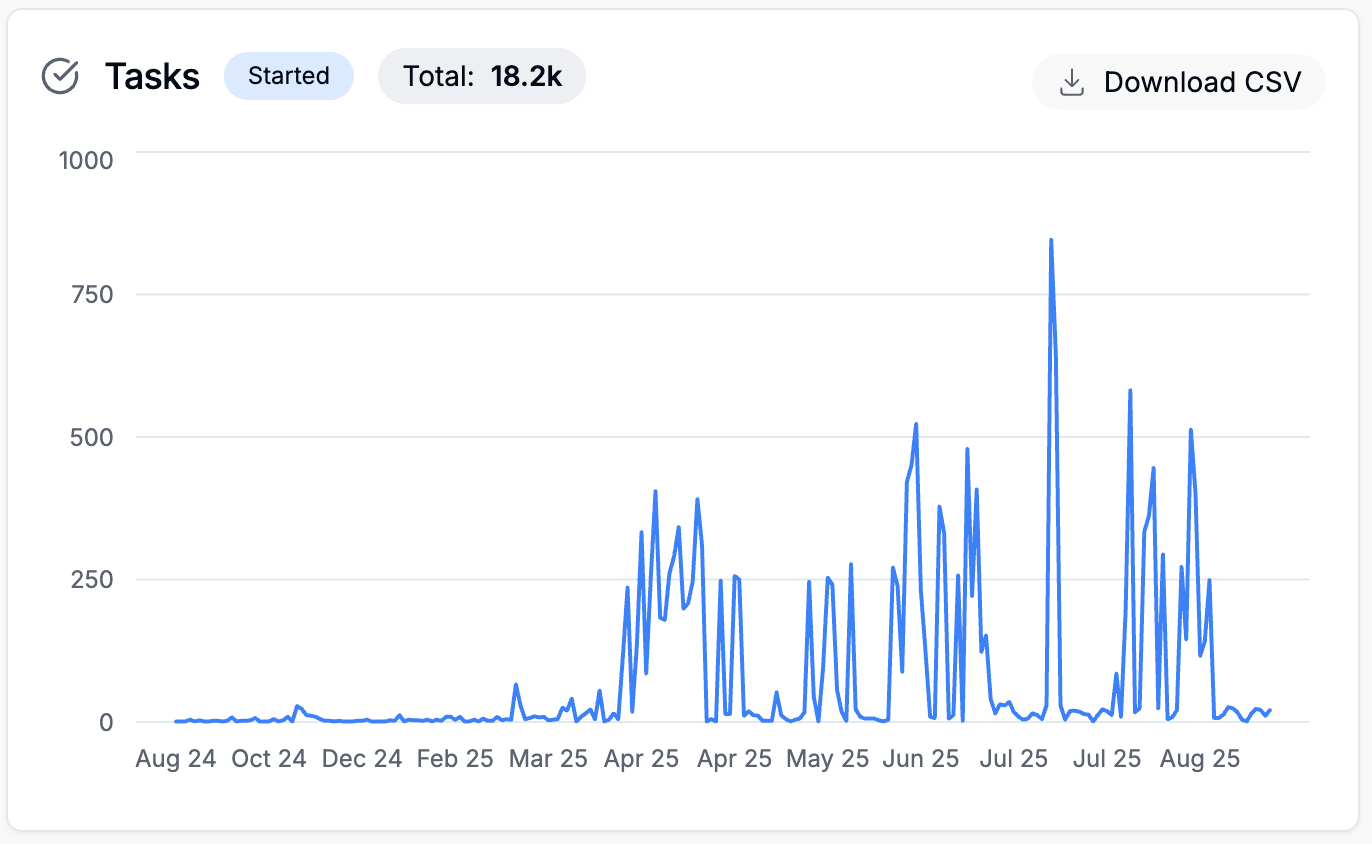
Definition: A Task represents a unit of work created or started through Cosine.
Chart: Displays the volume of tasks started over time.
Metrics: The Total count reflects all tasks initiated within the selected timeframe.
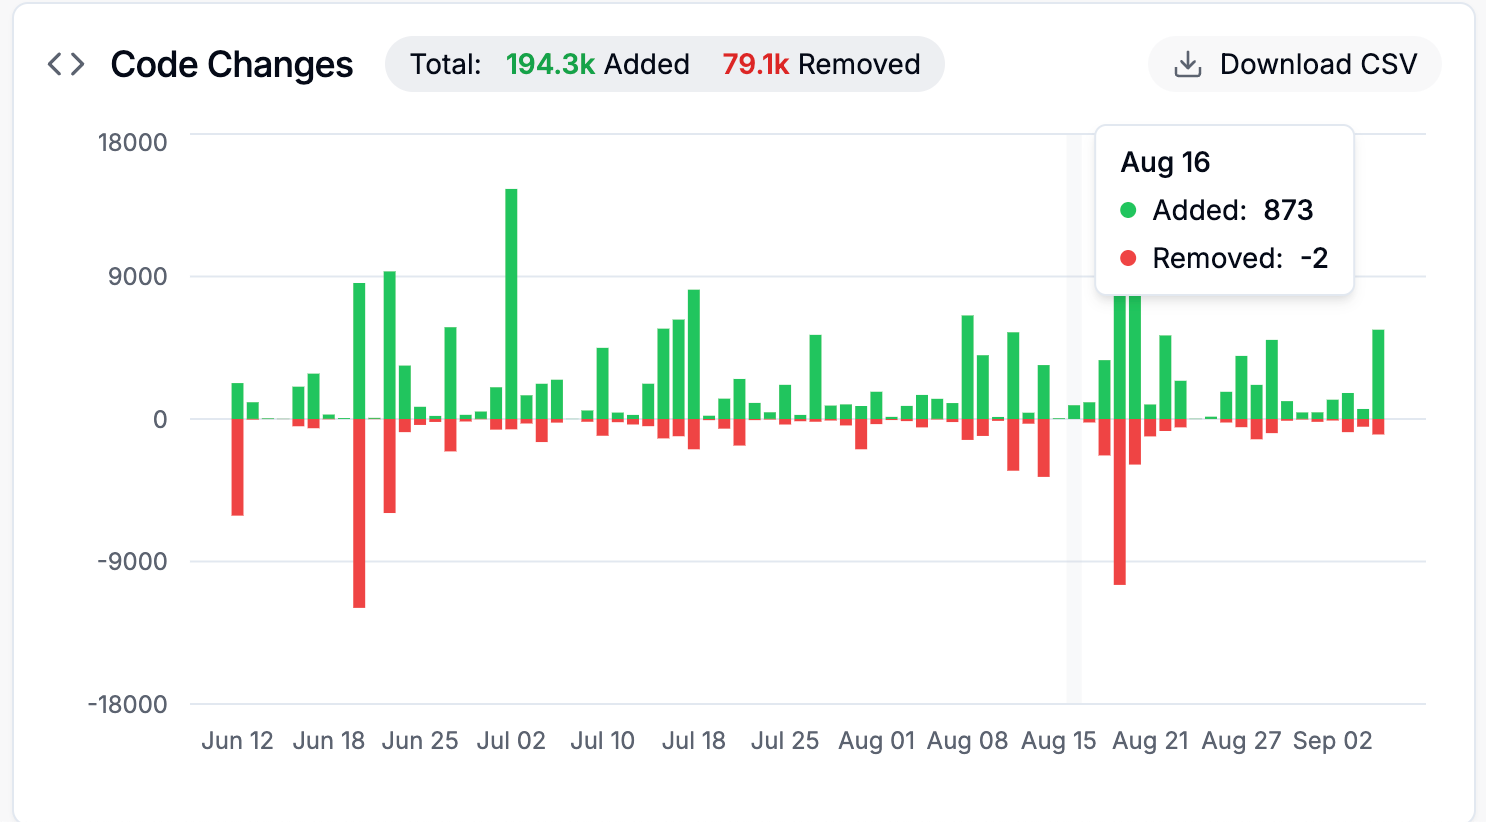
Code Changes
Section titled “Code Changes”Definition: Lines of code added or removed with Cosine.
Chart: Green bars represent lines added; red bars represent lines removed.
Metrics: The Total aggregates all additions and removals.
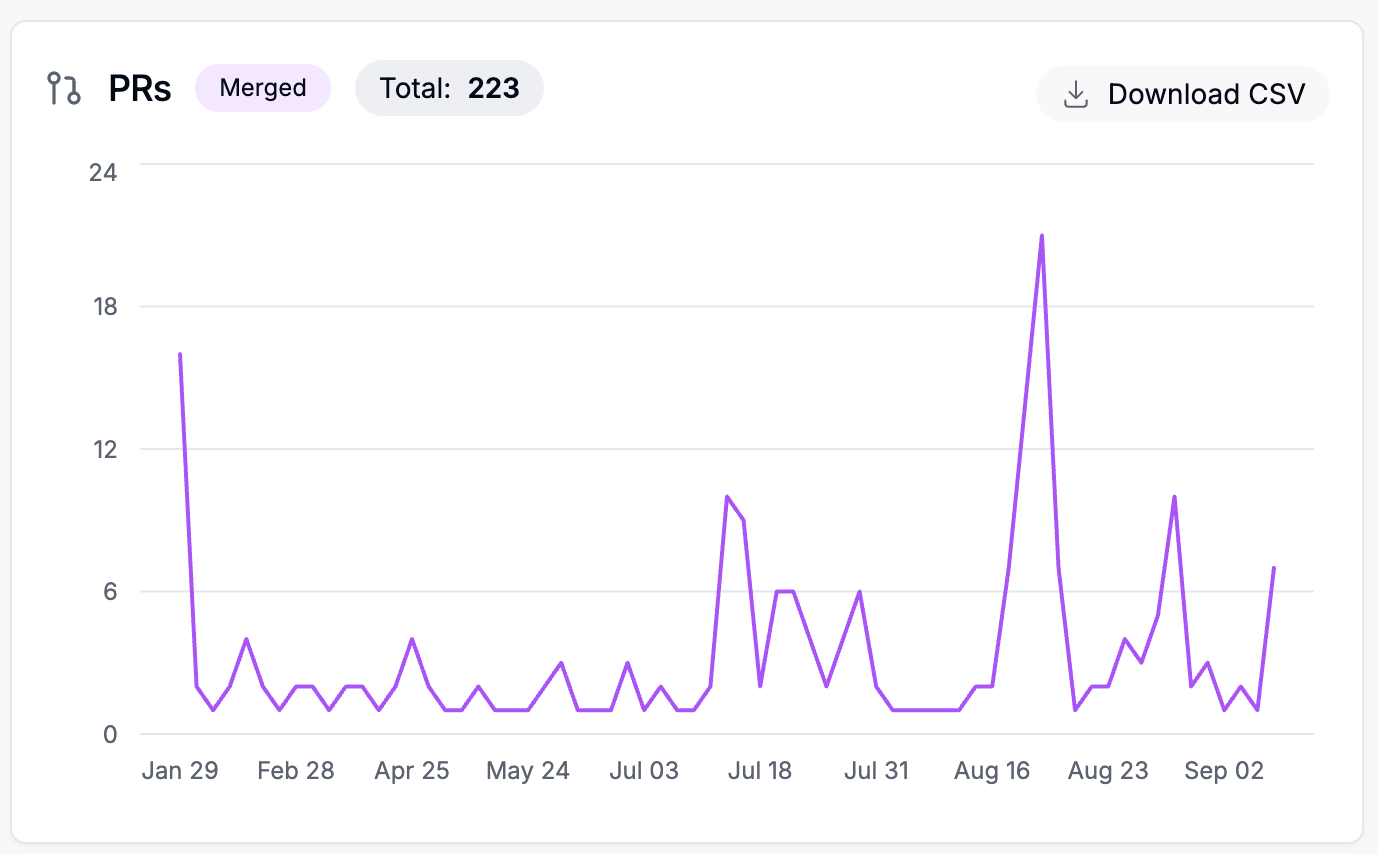
Pull Requests (PRs)
Section titled “Pull Requests (PRs)”Definition: : Pull Requests created and successfully merged with Cosine.
Chart: Shows the number of merged PRs over time.
Metrics: The Total count represents all PRs merged through Cosine in the selected timeframe.
Use Case: Gives visibility into how much of your development output is powered by Cosine across your codebase.
Genie Requests
Section titled “Genie Requests”Definition: Requests made to Genie, our proprietary software engineering model powering Cosine.
Chart: Displays the number of Genie requests over time.
Metrics: The Total reflects the overall volume of queries and tasks handled.
User Dashboard
Section titled “User Dashboard”When you access Insights from the user menu, you’ll see your personal dashboard. This view shows the same charts and metrics but scoped specifically to your across all your teams and projects.
The only available filter in this view is the date range selector.