

 Share
Share
One of the core parts of why Cosine is so good at understanding your codebase is all the effort we have put into our indexer. The Cosine indexer is a complex beast built upon a complex stack of embeddings, textual search, LSP, and static analysis.
One of the more finicky parts of this is our tree-sitter parsing step which at one point used a special webassembly distribution of tree-sitter.
Since moving this to work on the cloud we’ve been able to migrate to using the regular tree-sitter distribution in all its C-binding glory. However there was a problem – that we didn’t notice until months down the line.
On March 27th we were alerted to some odd behaviour on our indexing service.
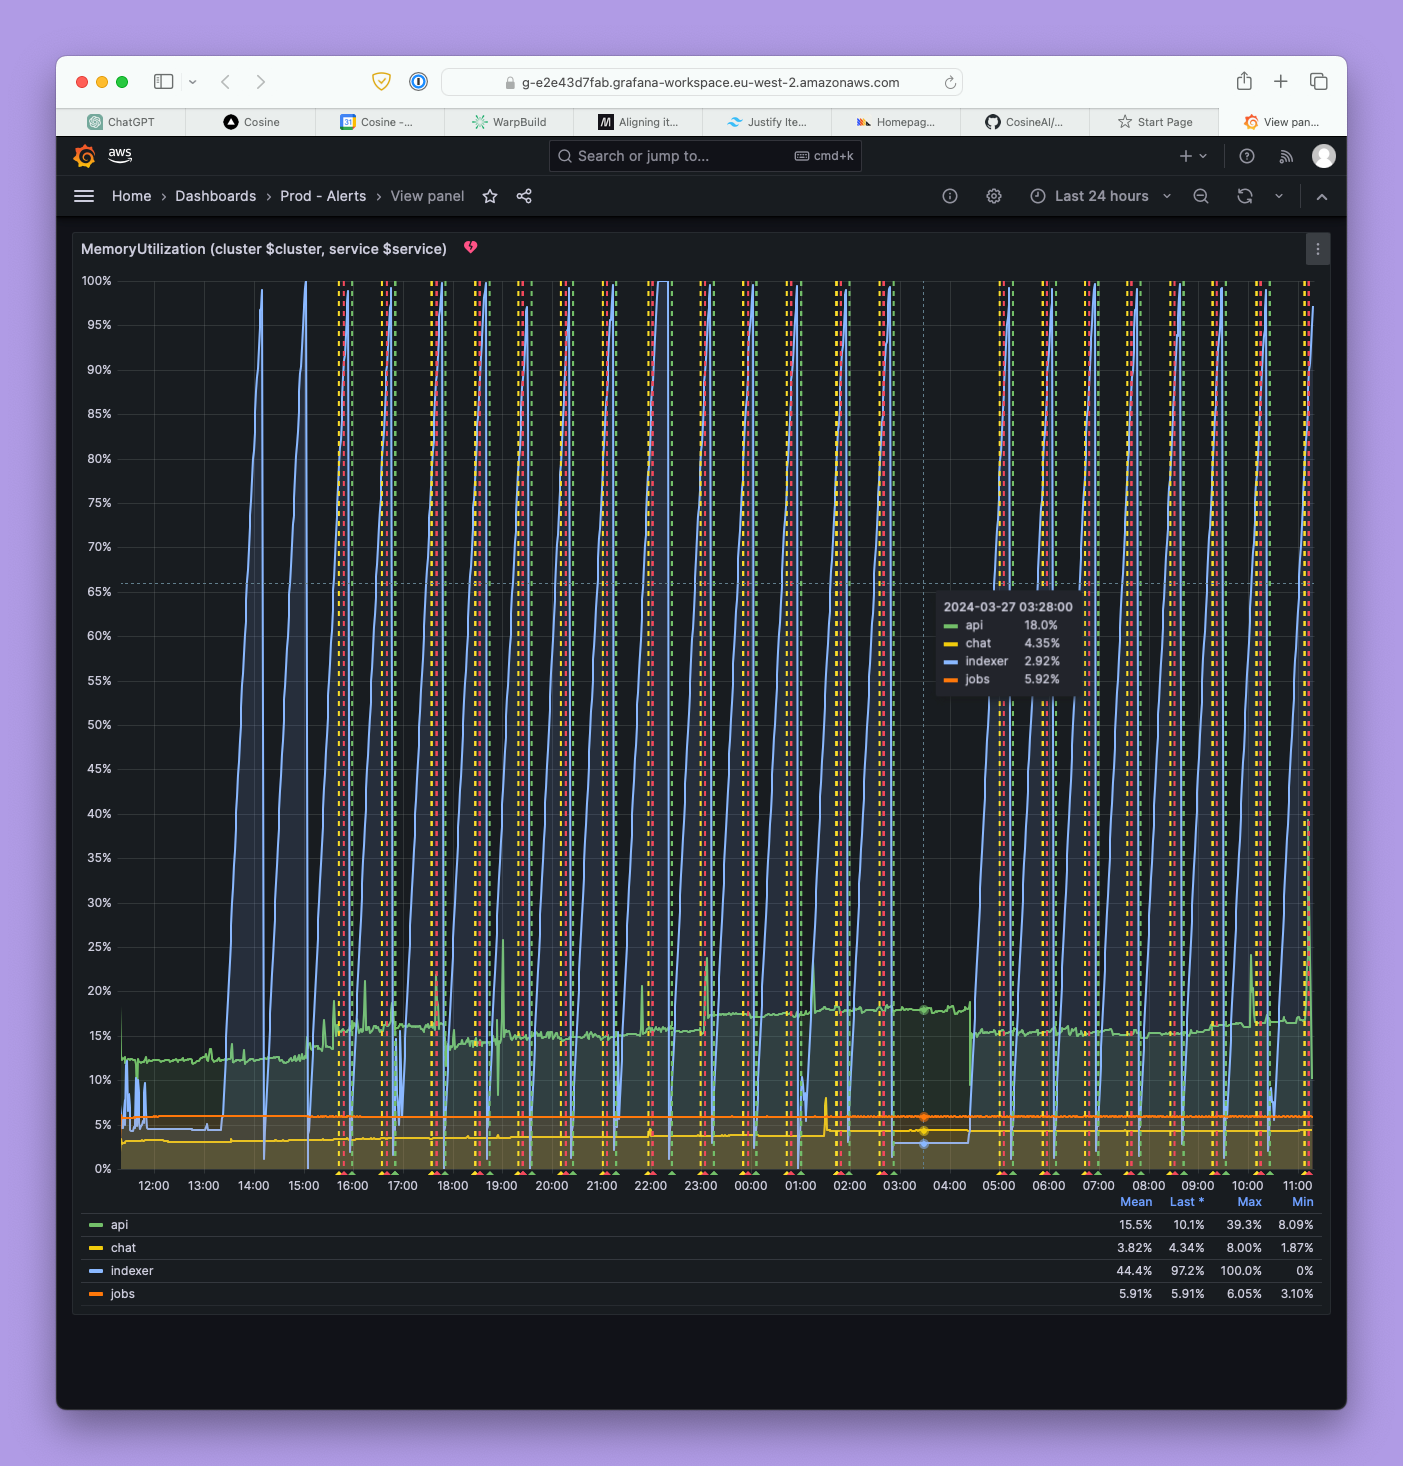
It was eating every byte of memory it could.
This became very obvious to us as we improved all the upstream processes and indexing steps leading up to the tree-sitter parser. With all these optimisations and the parser running at full speed it initially baffled us that by trying to go faster we were so much slower.
Lets dig into what was actually going on here.
Debugging the Issue
The first port of call was to attach the good ol’ Chrome debugger to the process and run the indexer. An initial run of the indexer on a small project produced the following memory profile:
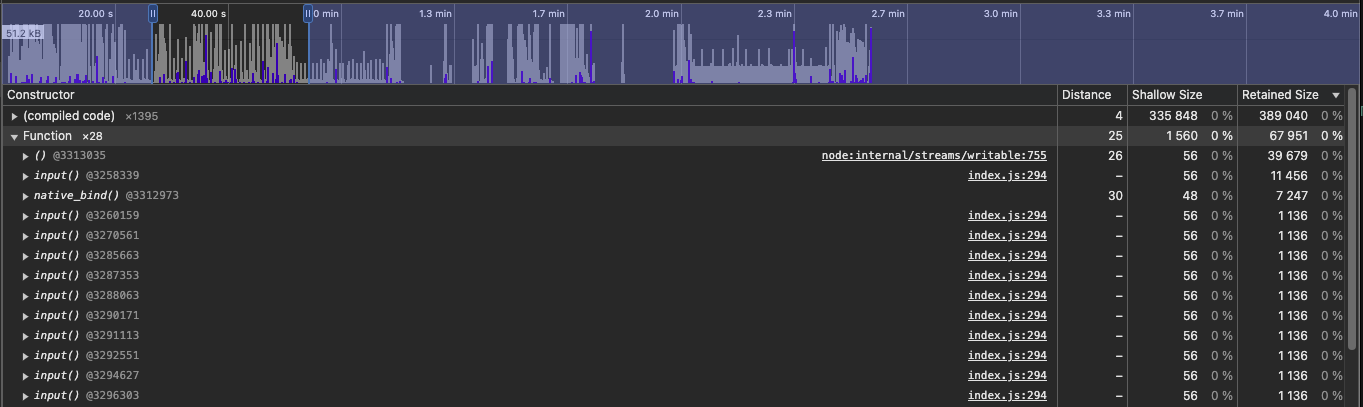
There is clearly a fair amount of memory being retained after the indexer has run. There are some large spikes of memory here and there, but most of this can be explained away with underlying libraries caching objects that are expensive to create, or even debugging symbols. The part of the memory profile that caught my eye is the highlighted section. It contains the bulk of retained objects, with a couple few larger spikes, but the interesting part is the smaller consistent spikes.
The gradual increase of memory usage matches with the behaviour we were alerted to in our indexing service which shows it growing at a very steady rate. The memory being retained in this instance may seem insignificant but this was running on a tiny project of maybe 200 LOC maximum. When you scale this up to a project of any reasonable size the memory impact becomes extremely detrimental.
So what is actually being retained? And why is it being retained? As far as the memory profiler is concerned it is a function named input in index.js from tree-sitter. Here is the relevant code where input is defined:
Parser.prototype.parse = function(input, oldTree, {bufferSize, includedRanges}={}) {
  let getText, treeInput = input
  if (typeof input === 'string') {
    const inputString = input;
    input = (offset, position) => inputString.slice(offset)
    getText = getTextFromString
  } else {
    getText = getTextFromFunction
  }
  const tree = this instanceof Parser && parse
    ? parse.call(
      this,
      input,
      oldTree,
      bufferSize,
      includedRanges)
    : undefined;

  if (tree) {
    tree.input = treeInput
    tree.getText = getText
    tree.language = this.getLanguage()
  }
  return tree
};
So, what can we learn from this function? input is defined as input = (offset, position) => inputString.slice(offset), and the only place it is used after that is as a parameter for parse.call(). Therefore something in parse.call() must be retaining input and by extension inputString.
Now, I know nothing about the node-tree-sitter codebase and I’ve had very little dealings with bindings before. I don’t know what parse.call() is calling out to, or what kind of code I should be looking for. Fortunately there is a great tool that can learn about a codebase much faster than me - Cosine.
Solution
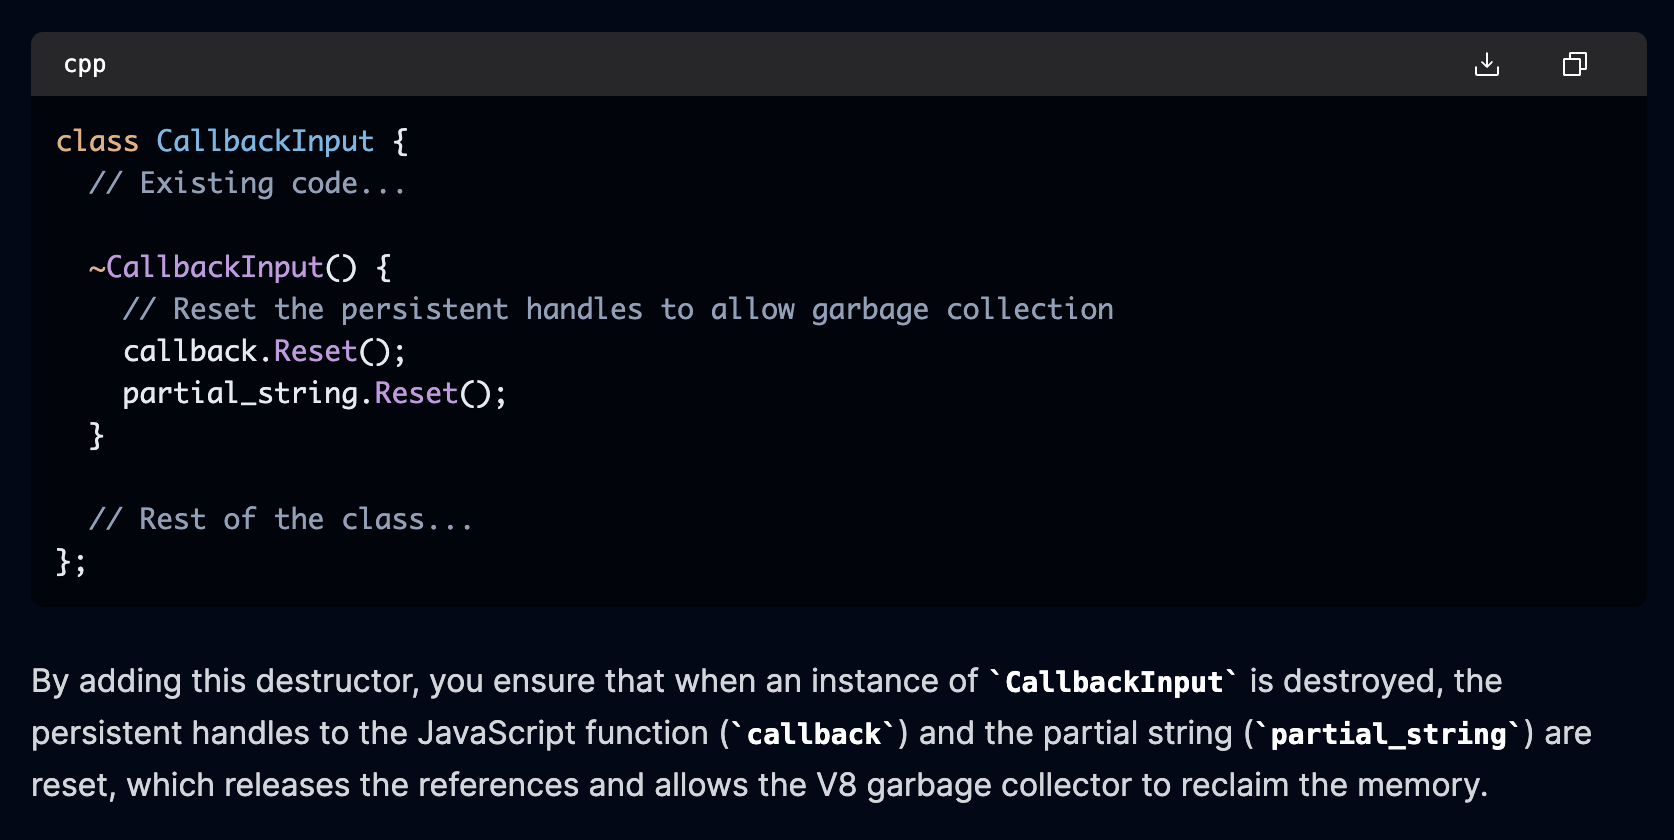
Using our platform I indexed node-tree-sitter and chatted with Cosine about it. We very quickly traced the code to the class CallbackInput in src/parser.cc and came to the conclusion that we simply need to add a destructor to the class. All it needs to do is reset both callback and partial_string.
After some time spent cloning node-tree-sitter, making the changes, and forgetting to compile the project more than once; we were finally ready to do another run to evaluate our proposed fix:
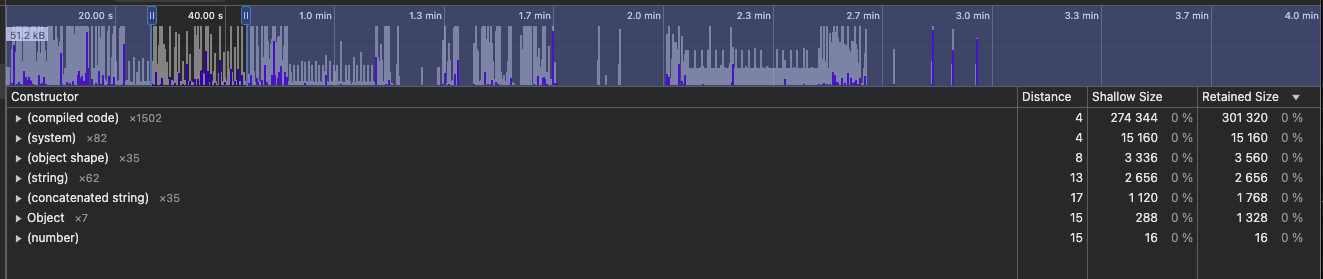
On this run we can see that there are no input functions being retained! I would call that a success. Of course there may be more memory leaks that need to be addressed but most of the remaining objects are actually debug symbols.
And with that there is only one thing left to do; raise a PR to node-tree-sitter.
Takeaways
There’s a lot to learn and take forward from this little excursion, as well as a few things that are always worth reiterating.
- Monitoring and alerting is fundamental - knowing when a service is misbehaving as soon as possible is crucial for providing a stable service and resolving any issues when they occur.
- Develop with scale in mind - during development we typically test indexing with small projects and in this case it was easy to overlook the memory leak or to assume that it was too small to have such a big impact on the service. It is important to consider how solutions, and their resource usage, scale with the data it processes.
- Cosine is here to help - Cosine was instrumental in helping me to understand how tree-sitter codebase worked. So much time was saved in tracking down the relevant code snippets, their role in the project and how to alter them effectively